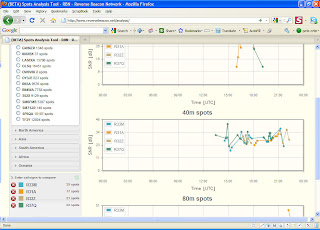
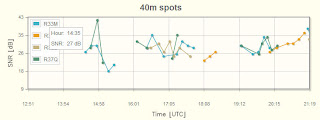
 This screen shows the basic features of the tool (click on the image for a magnified version). First, you choose a date (above the screen shown, on the left). Then select a continent, and the tool tells you which reverse beacons (or skimmers, if you prefer) were active on that day, and how many spots each made. Select a reverse beacon, and move to the bottom of the screen where a box invites you to "ADD" a callsign. Type one, click the ADD button, and any spots of the station will be plotted, band by band.
Now the best part. Add another, and the tool compares the signals of the two stations. Add more (up to 10, total), and their signal strengths are plotted on the screen.
 If you want, you can zoom in on the graph and examine the individual spots more closely. You can also change reverse beacons, add or delete stations to compare, and zoom in on multiple graphs.
In the example above, I compared the signals of several WRTC stations in Europe. It looks to me that the organizers achieved their goal of equalizing signals pretty well.
73, Pete N4ZR

It is pity that RBN doesn't work with dominant IE8 browser! Get professional as VE3NEA, please.
ReplyDelete73 de Mario, S56A, N1YU